
What Is Business Process Mapping? +Types, Symbols
- Published: November 3, 2023
- Updated: November 8, 2023
Understanding the intricacies of your organization’s workflows is essential for companies to be agile and efficient. Business process mapping is a transformative exercise that provides a visual depiction of the contextual steps involved in business processes.
This methodology is not just about drawing lines and boxes; it’s a strategic approach that unveils the nuances of how a business operates, identifies areas for improvement, and unlocks the potential for streamlined operational efficiency.
The utility of business process mapping extends across various organizational goals. It serves as a vital communication aid, a diagnostic tool to uncover inefficiencies, and a roadmap for effective change management.
In creating a process map, designers and end-users must understand the symbology—a language of shapes and icons that can communicate complex workflows at a glance. These symbols form the lexicon that, when mastered, allows for precise and universally comprehensible process documentation.
Research indicates that companies that adopt thorough process mapping are 30% more likely to spot inefficiencies than those that don’t, showcasing why this technique has become a cornerstone in operational management.
A 2022 study from the American Society for Quality revealed that businesses that regularly revisit and update their process maps reduce operational waste by an impressive 50%, underscoring the dynamic nature of process documentation and process documentation tools.
In this article, we explore the concept of business process mapping. From defining its core principles to diving into the creation of a map and decoding the key symbols, we will equip you with the knowledge to transform the abstract flows of your business into concrete pathways to success.
What Is Business Process Mapping?
Process mapping (also known as process modeling) is a core component of business process management that involves breaking down an organization’s workflows, SOPs, and processes into detailed visual flowcharts that illustrate how they work.
Ultimately, the goal of business process mapping is to:
- Identify and define specific business processes within an organization.
- Visualize the relationship between different process elements using flow charts.
- Examine these visual representations to understand the sequence of activities, decision points, and interactions involved.
- Identify opportunities for improvement.
- Document the processes, making it easier for employees to follow standardized procedures and achieve process governance.
What’s the Purpose of Business Process Mapping?
In a small team of 1 – 20 staff who work together on a 1:1 basis, taking time to document and map processes doesn’t make much sense since every team member innovates on the fly; but as your organization scales up, processes multiply and the potential for error increases exponentially.
To ensure tasks are completed accurately and efficiently, you must document and standardize business processes to ensure every stakeholder follows best practices. Other benefits of process mapping include:
- Improving efficiency through process optimization.
- Identifying process bottlenecks and areas of friction.
- Simplifying big concepts and ideas.
- Setting new KPIs and metrics.
- Ensuring compliance and quality assurance.
- Delegating responsibilities and succession planning: Document and transfer knowledge required for critical positions to prevent dereliction as your team’s structure changes.
- Empowering new hires with better employee onboarding.
- Accelerating digital adoption with easy-to-use SOPs and documentation for using enterprise applications and navigating digital workflows.
RECOMMENDED Article

How to Map Your Business Processes
As the saying goes, a picture is worth a thousand words. And that’s easily the best way to describe a process map. They explain complex concepts, workflow relationships, step-by-step progressions, and input/output points in an easy-to-follow 2D manner.
First, we recommend a business process mapping tool – but from there, here’s a step-by-step breakdown of creating a process map and what it entails.
1. Identify the processes you intend to map
It could be for onboarding new employees, processing accounts payables, qualifying sales leads and closing deals, forecasting demand, managing suppliers, or even managing projects. Still, the size and scope of the process you’re trying to map will ultimately determine how comprehensive your efforts will be.
2. Meet with stakeholders and document all process activities
The stakeholders who are responsible for operating a process will inform you on what tasks need to be carried out from the start to finish of the process in question, the different stages where human (or machine) decision-makers are required, and every interaction that occurs when the process in question is engaged.
3. Arrange these activities into sequential steps
After you’ve shortlisted all the stages of the process you’re trying to map, the next step is to arrange them into a logical sequence that represents how you’d execute the process in practice.
For instance, let’s say you’re trying to map your accounts payables process, organize it into a start-to-finish, and break all the interactions, tasks, and input/output stages to ensure your suppliers are getting paid (on time), fraud is reduced as close to zero as possible, and that you have a trusted paper (or digital) trail for every transaction.
For this example, your process breakdown will probably look like this:
- Receipt of Invoices: Suppliers or vendors send invoices for goods or services provided to the company.
- Invoice Review and Verification: AP reviews invoices for accuracy and confirms the goods/services billed for match existing POs.
- Approval Workflow: Ensure any requisite signatures or approvals across your organization have been collected.
- Data entry: The invoice data, including supplier information, invoice amount, and due date, is entered into the company’s accounting or ERP (Enterprise Resource Planning) system.
- Payment Terms and Due Date: AP team determines the payment terms and due date for each invoice, considering any early payment discounts or extended payment agreements.
- Approval: This might require one or more authorization levels, depending on company policies.
- Processing: Once invoices are approved for payment, the accounts payable department initiates the payment process.
- Record Keeping: Maintain records of all invoices, approvals, and payments for auditing and financial reporting purposes.
- Payment Confirmation & Follow-ups: Confirm that payments have been successfully processed and sent to the suppliers and keep communication channels open (email, Slack, etc.) to address any discrepancies, resolve issues, and provide updates on payment status.
4. Select a format for your business process map and start to design it
The process map format you opt for will depend on your organization’s specific needs, the complexity of the process, and your audience. Here’s a brief breakdown of the different types of process maps you can choose from.
- Flowcharts: Flowcharts are versatile and are usually the default for plotting uncomplicated, sequential processes. They use standard symbols and shapes to represent different elements and stages of interaction within a process.
- Swimlane Diagrams: Also known as cross-functional or deployment flowcharts, swimlane maps break down processes by designated stakeholder or the department responsible. They’re perfect for training employees, assigning tasks, eliminating redundancies, and keeping stakeholders accountable.
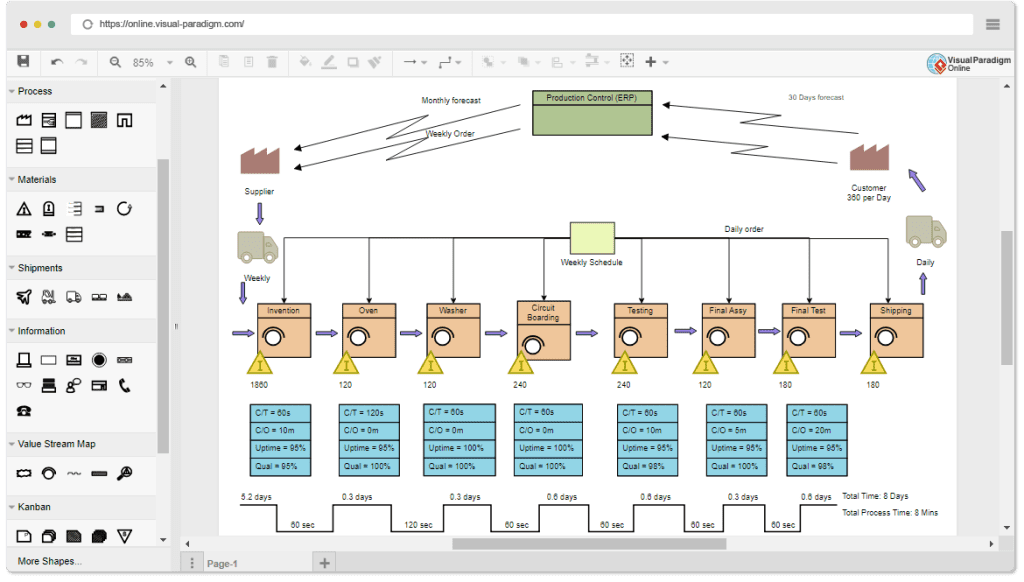
- Value Stream Maps: Value stream maps are used to document cycle times and the number of stakeholders involved in each step of a process in order to identify and eliminate waste in the process.
- SIPOC diagrams: SIPOC stands for Suppliers, Inputs, Process, Outputs, Customers and is more of a chart for identifying the key elements, stakeholders, and input/output points within a process.
- A detailed process map breaks down processes down to their basic steps and subprocesses and highlights every task and interaction required to successfully complete them.
- High-level process maps offer a brief, summary view of a process and highlights the essential aspects required to run it successfully, from start to finish.
- Data flow diagrams (DFDs) map the flow of information through a process or a system, including input/output stages, storage, and the processing workflow that’d be hard to describe verbally.
5. Solicit and incorporate feedback from stakeholders on the process
Your stakeholders who are the cogs in the wheel of your processes (and who work on them daily) are in the best position to advise you on how to reduce inefficiencies, eliminate redundant steps, free up resources, and create safeguards to make your processes bullet-proof.
Here are some questions that can get the conversation going and help you understand where your process maps might need to be simplified or edited for clarity.
- Can you confirm that the depicted process accurately represents how you currently perform your tasks?
- Do you find the symbols and labels used in the process map clear and understandable?
- Are there any parts of the process map that are confusing or need further explanation?
- Are the timing and sequencing of activities in the process map correct?
- Are there any dependencies or parallel activities that are not accurately represented?
- Are there any bottlenecks or delays in the process that need to be addressed?
- Are the roles and responsibilities of individuals or departments in the process clearly defined?
- Do you see any overlaps or gaps in responsibilities?
- Are there any regulatory or compliance requirements that the process must adhere to? Is the process map aligned with these requirements?
- How does this process interact with or depend on other organizational processes?
- Are any handoffs or interfaces with other departments or systems that need to be highlighted?
6. Share the business process map and improve as required
After incorporating feedback from your stakeholders, you can safely roll out your process map for daily usage. To ensure that you’re adopting changes and improvements as required, you need to schedule (recurring, if possible) review sessions to assess whether your process maps still reflect an accurate image of your day-to-day interactions, tasks, and dependencies.
Common Symbols Used in Process Maps
A process map is a 2D representation of a 3D concept—as a result, the quality of the finished product depends on how well you understand the different stages of a process and how they can be mapped to a 2D diagram.
Here’s a list of representative symbols useful in your process mapping journey:
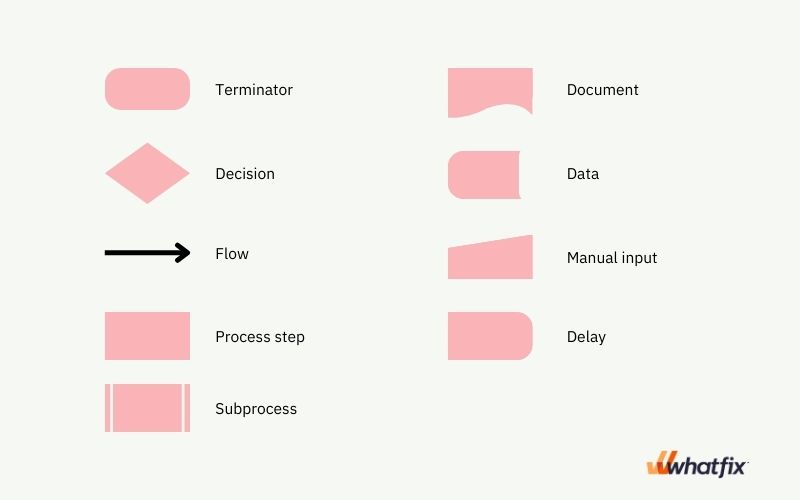
- A terminator is always oval-shaped and denotes the first and last steps (or start/finish) of a process.
- Flows are directional arrows that show how a process flows (i.e., from here-to-there).
- Process steps are rectangles representing activities, tasks, or interactions made within a process.
- Decisions are diamond-shaped and highlight intersections where yes/no decisions must be made.
- Delays are D-shaped symbols highlighting parts of a process where there’s a pause in the workflow or where a task might take longer than usual to complete, due to factors such as bottlenecks, approvals, processing times, etc.
- A document is represented by a wavy bottom line that shows some information people can read up on.
- Data is shown by a parallelogram and highlights an input/output stage of a process.
- A manual input is represented by a rectangle with rounded corners and shows a task to be performed by a human operator.
- Subprocesses refer to smaller constituent processes that may have been mapped in any process. They’re often used in high-level process maps where in-depth detail isn’t required or preferable.
Analyze, create, and deliver the most efficient processes with Whatfix’s in-app guidance and analytics
Let’s circle back to steps 2 through 5 of our process mapping guide. Between those stages, your goal is to document every interaction required to complete a process, and regularize those performed on an ad hoc basis.
But, the larger your organization, the easier it is to let a few steps fall through the cracks, especially if you have a handful of stakeholders improvising and using their shortcuts on the job. Secondly, it’s not unusual for medium-to-large-scale enterprises to run several hundred (or thousand) processes running on a daily or weekly basis.
At that scale, even coaching newer employees and bringing them up to speed on your processes becomes another humongous process that requires a dedicated department.
That’s where Whatfix comes in.
Whatfix’s digital adoption platform enables application end-users with in-app guided experiences like Task Lists and Flows that take employees step-by-step through complex, contextual, role-based processes.
Self Help provides employees with real-time support with contextual help depending on where they are in an application. Smart Tips, Beacons, Pop-Ups, and Field Validation all help alert, nudge, and keep end-users using processes and fields correctly.

Whatfix’s product analytics software provides insight into how your employees, partners, and stakeholders interact with digital assets, including undocumented shortcuts and hacks that the rest of the organization would benefit from. That way, you can get an unfiltered view that helps you optimize processes to run more efficiently.
Its User Actions and Enterprise Insights enable organizations to identify areas of end-user friction, build optimal process flows, track custom events, and ultimately drive end-user adoption of applications and their complex digital business processes.

What Is Whatfix?
Whatfix is a digital adoption platform that provides organizations with a no-code editor to create in-app guidance on any application that looks 100% native. With Whatfix, create interactive walkthroughs, product tours, task lists, smart tips, field validation, self-help wikis, hotspots, and more. Understand how users are engaging with your applications with advanced product analytics.
Like this article? Share it with your network.
Subscribe to the Whatfix newsletter now!
Table of Contents

Software Clicks With Whatfix
Whatfix's digital adoption platform empowers your employees, customers, and end-users with in-app guidance, reinforcement learning, and contextual self-help support to find maximum value from software.


Thank you for subscribing!
Sign up for the Whatfix blog
Join 300,000+ monthly readers learning how to drive software adoption by signing up to receive the latest best practices and resources.